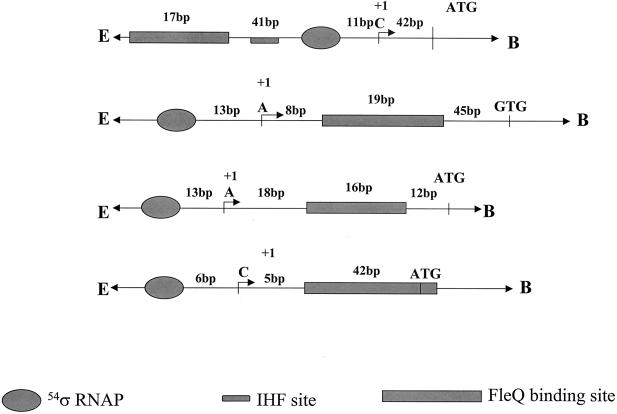
FIG. 6.
Schematic representation of the fleSR, flhA, fliE, and fliL (top to bottom) promoter regions showing the relative positions of the FleQ binding sites with respect to the TSSs and the RpoN binding and translational start sites. The integration host factor (IHF) binding site in the fleSR promoter is shown.

