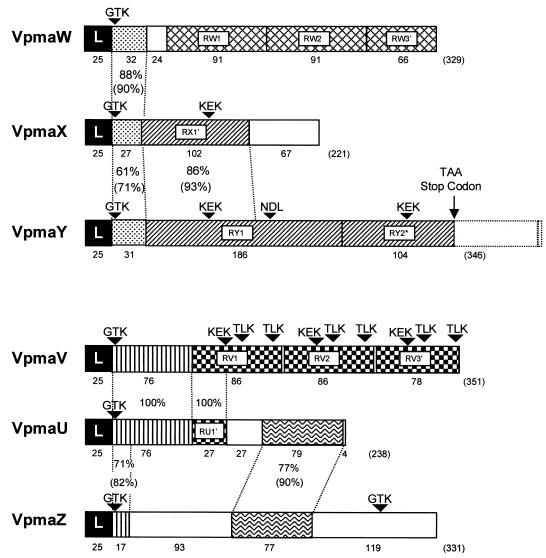
FIG. 2.
Schematic of vpma ORFs. The ORFs are represented by boxes and begin with a homologous 25-aa leader sequence (L) followed by regions that have homology between genes or regions that are repeated (R, followed by gene designation, or R' for truncated repeats) within a gene. Homologous regions or repeated sequences are indicated with the same pattern, and unique sequences are not shaded. The percentages of amino acid identity between homologous regions between genes are indicated, and the percentages of similarity are in parentheses. The theoretical molecular mass (kDa), pI, and percentage of charged amino acids, respectively, calculated from the mature polypeptides for VpmaU, VpmaV, VpmaW, VpmaX, VpmaY, and VpmaZ are 23.2, 6.90, and 37%; 35.0, 9.09, and 34%; 33.1, 9.43, and 31%; 22.4, 6.33, and 42%; 35.2, 8.27, and 34%; and 34.2, 7.01, and 32%. Arrowheads indicate possible epitopes involved in host cytadhesion based on those determined for vsps from M. bovis (32).

