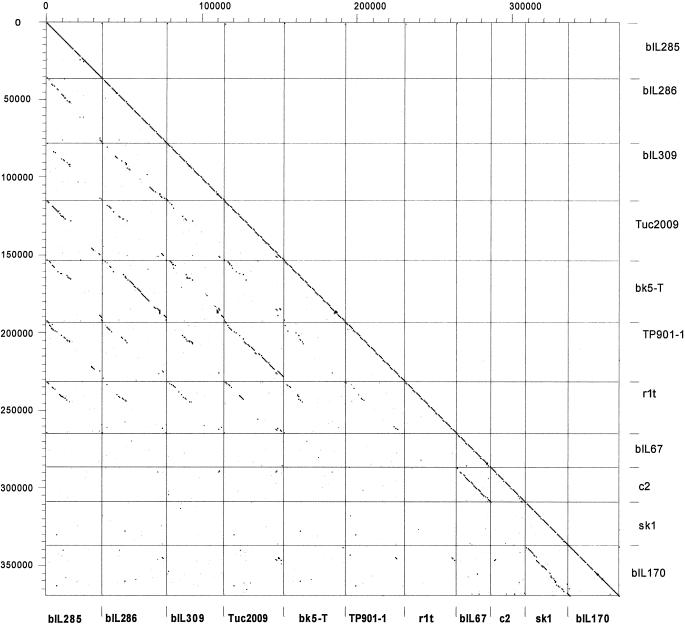
FIG. 4.
Dot plot matrix calculated for the complete genomes of the L. lactis prophages bIL285, bIL286, and bIL309, all from the genome sequence of L. lactis strain IL1403 (13), of the temperate L. lactis phages Tuc2009 (P335 lactococcal species, proposed Sfi11-like genus of pac site Siphoviridae), BK5-T (BK5-T lactococcal species, proposed Sfi21-like genus of cos site Siphoviridae), TP901-1 (P335 lactococcal species, proposed Sfi11-like genus of pac site Siphoviridae), r1t (P335 lactococcal species, new r1t/LC3-like genus (?) of cos site Siphoviridae) and of the virulent L. lactis phages bIL67 and c2 (both c2 lactococcal species, c2-like genus of Siphoviridae) and sk1 and bIL170 (936 species of lactococcal phages, new sk1-like genus (?) of Siphoviridae). The prophages and temperate phages are aligned so that the phage integrase is at the utmost left (top) of each indicated square, followed by the lysogeny and DNA replication modules; in the center are the structural genes (DNA packaging, head, and tail genes); at the right (bottom) of each indicated square are tail fiber and lysis genes. The virulent phages are given with the late structural genes at the right and the early nonstructural genes at the left. The BK5-T and c2 sequences were rearranged or inversed, respectively, with respect to the database entry. The left y axis provides a scale in kilobases; the right y axis and the bottom x axis identify the phage genomes that were compared in the corresponding square. The dot matrix was calculated using Dotter (50). The comparison window was 50 bp, and the stringency was 30 bp.

