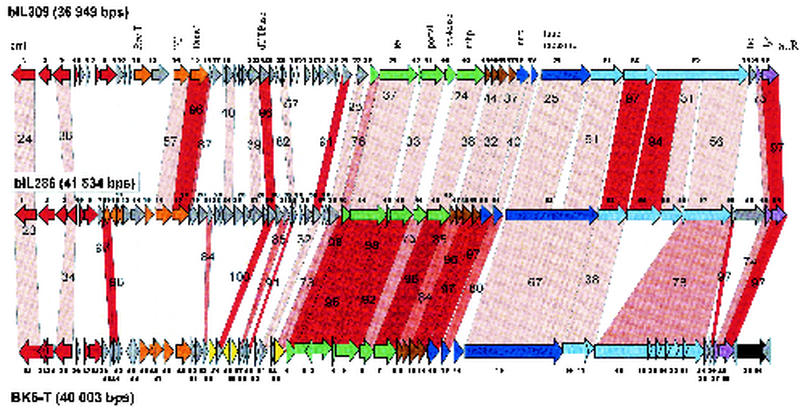
FIG. 5.
Alignment of the genetic maps from the L. lactis prophage bIL309 with the L. lactis prophage bIL286 and temperate L. lactis phage BK5-T. The open reading frames are color coded according to their predicted function as in Fig. 1. Selected genes or genomic features are denoted. Genes encoding proteins that showed significant amino acid sequence are linked by red shading, and the percentage of amino acid identity is indicated. The degree of amino acid identity (>90, >80, >70, or <70%) is reflected in the color intensity of the red shading.

