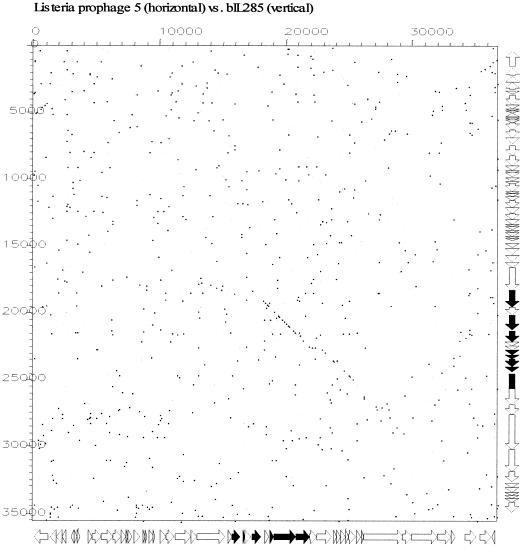
FIG. 7.
Dot plot analysis for the L. innocua prophage 5 (29) genome versus the L. lactis prophage bIL285 genome. The comparison window was 50 bp, and the stringency was 30 bp. Genes sharing nucleotide sequence similarity are highlighted in black on the gene maps (see Fig. 6 for an expanded view of the prophage maps) of the phages depicted at the sides of the dot plot.

