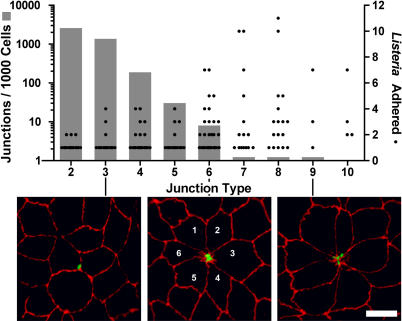
Figure 3. Tropism of L. monocytogenes for Multicellular Junctions.
Cell junction types and L. monocytogenes adhesion sites were analyzed by quantitative confocal microscopy. The grey bars (left, y-axis) represent the frequency of junction types, defined as the number of cells that meet at a junction, based on analysis of three randomly imaged regions (~500 cells/region) of a polarized MDCK monolayer. The black circles (right, y-axis) represent the number of L. monocytogenes adhered per junction type. Pearson correlation coefficient r = 0.95, p = 0.0001. Bottom: examples of adhesion sites shown by confocal microscopy and visualized with antibodies to L. monocytogenes (green) and ZO-1 (red). L. monocytogenes adhered to multicellular junctions with 3, 6, and 9 cells are shown. Scale bar 10 μm.

