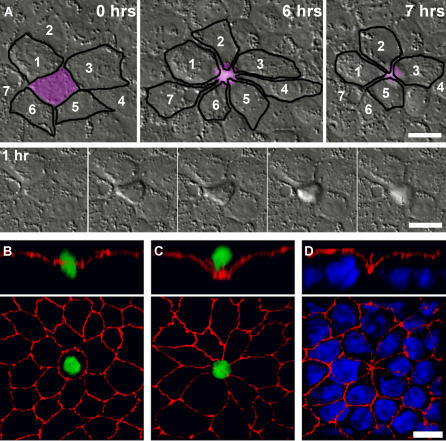
Figure 4. Multicellular Junctions Created by Cell Extrusion.
(A) Top panels show reorganization of cells around a site of cell extrusion monitored live by time-lapse differential interference contrast microscopy. The extruding cell is colored in purple, and adjacent cells are outlined in black to show changes in the shape and relative location of the cells over time. The cells surrounding the extruded cell are numbered to illustrate their position at the start and after resolution of the multicellular junction. The bottom strip shows the process of extrusion, beginning at hour 1 of observation, and continuing for 40 min; frames at 10-min intervals.
Early (B) and late stages (C) of cell extrusion from a polarized MDCK epithelium were imaged by confocal microscopy after staining the monolayer for apoptotic nuclei with Sytox green and with antibodies to ZO-1 (red).
(D) Staining of all the cell nuclei in the monolayer with toto-3 (blue) illustrates that a missing nucleus is evident at extrusion sites after cell extrusion is completed. Reconstructed Z-section panels (B–D, top) reveal the rearrangement of junctions that occurs during cell extrusion.
Scale bar 10 μm.

