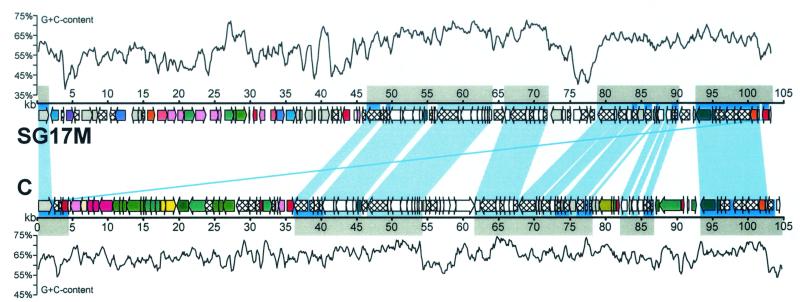
FIG. 3.
Comparison of the strain-specific gene islands in P. aeruginosa SG17M (upper line) and C (lower line). Genes are represented by arrows as in Fig. 2. Homologous ORFs are linked by light blue bars. A slightly darker blue line connects the corresponding bphR genes located at the right border of the SG17M gene island and at the left border of the C-specific insertion. Genes with homologs in the X. fastidiosa gene island are highlighted with a dark blue background. Gray boxes above and below the gene maps mark all ORFs that are presumably associated with the mobilization and transfer of the gene islands (called noncargo ORFs in the text; compare with Tables 2 and 3 for the corresponding gene identification numbers). Additionally, a 500-bp sliding window plot of G+C content is displayed for each gene island.

