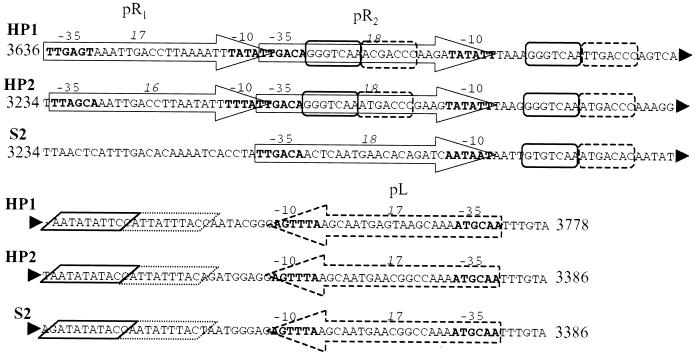
FIG. 3.
Early promoter comparison among HP1, HP2, and S2 type A. The numbers on either side of the sequences denote the nucleotide positions of these loci in their respective phages. Large arrows delineate the promoter elements with the −35 and −10 sites in boldface and labeled. Italic numbers denote the spacing between the −35 and −10 sites. Dashed lines indicate elements contained on the opposite strand. Rounded boxes identify sequences consistent with the cI repressor binding sites, and the parallelograms indicate the cox repressor binding sites.

