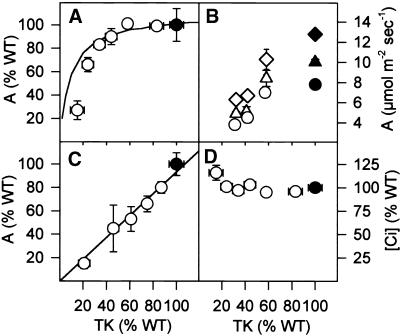
Figure 5.
Photosynthesis.
(A) Photosynthesis at 170 μmol m−2 sec−1 and ambient CO2.
(B) Photosynthesis at 220, 350, or 700 μmol m−2 sec−1 and ambient CO2.
(C) Photosynthesis in saturating light and saturating CO2.
(D) CO2 concentration inside the leaf ([Ci]).
Plants were grown in a greenhouse in natural irradiance supplemented with 170 μmol m−2 sec−1, with light intensities increasing to ∼600 μmol m−2 sec−1 on sunny days. TK activity was measured in each leaf area after the measurement of photosynthesis was completed. The results are given as means ±se, and each individual data point corresponds to five to seven separate wild-type (WT) plants (closed symbols) or three to seven transformants (open symbols). Photosynthesis was measured at 350 ppm CO2 on an overcast day (A) without additional light or (B) with supplementary light to bring the intensity in the cuvette to 220 (circles), 350 (triangles), or 700 (diamonds) μmol m−2 sec−1, and (C) at ∼5000 ppm CO2 and 700 μmol m−2 sec−1. [Ci] (D) was calculated from the rate of photosynthesis and stomatal conductance, as determined in parallel with photosynthesis.

