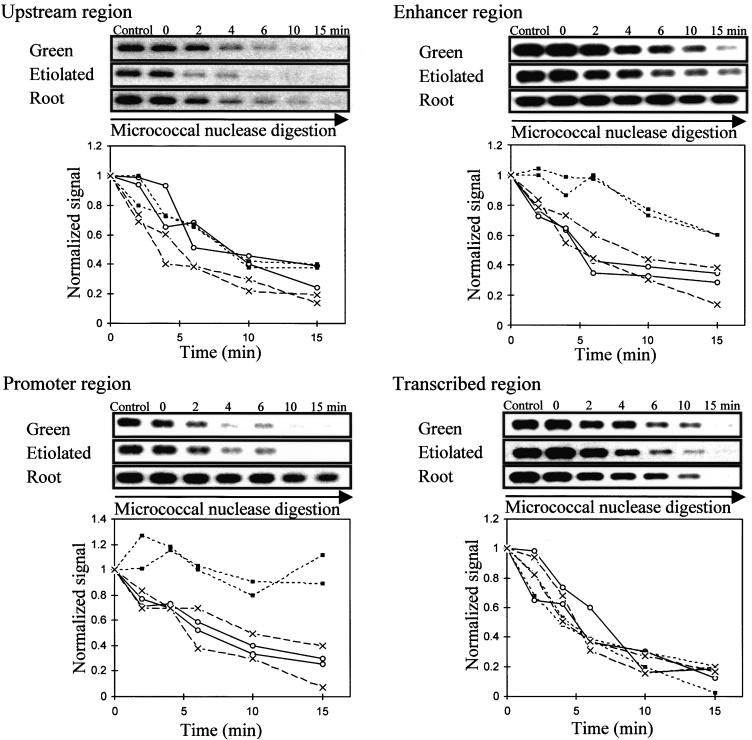
Figure 5.
Accessibility of Regions of PetE to Micrococcal Nuclease.
Nuclei were incubated with micrococcal nuclease for the times indicated. Control represents a reaction without added micrococcal nuclease. The amount of DNA sequence present at each time was determined by PCR. The PCR products were separated on an agarose gel, transferred onto GeneScreen Plus membrane, probed with 32P-labeled PCR products, exposed to x-ray film, and quantified. The upstream (−800 to −449), enhancer (−444 to −177), promoter (−195 to −56), and transcribed (−103 to +504) regions of PetE were examined. For each region of PetE, PCR products obtained for each time are shown at the top, and degradation curves for two independent digestion experiments for each pea organ are shown at the bottom. The amount of DNA present at each time was normalized to that at time 0 and plotted against time to compare degradation rates in green shoots (open circles), etiolated shoots (crosses), and roots (closed squares).

