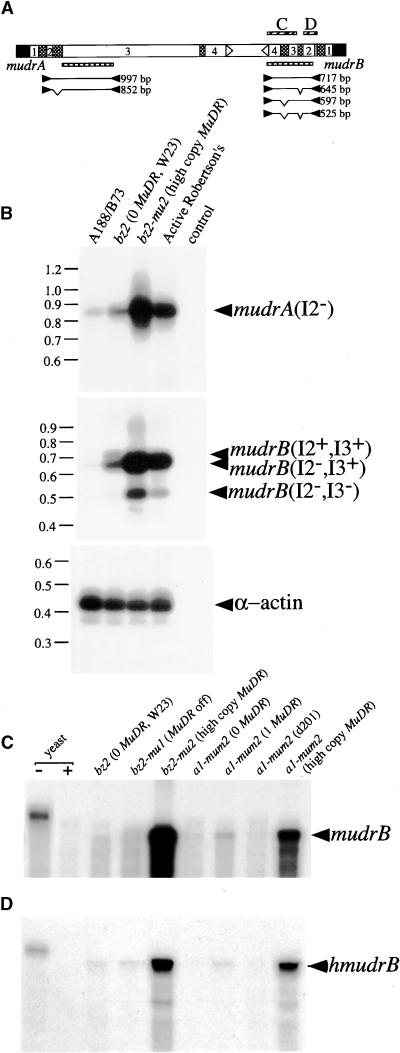
Figure 5.
RNA Expression Patterns.
(A) Diagram of primers (closed arrowheads), expected products (lines along with calculated sizes), and corresponding hybridization probes (hatched boxes) used in RT-PCR reported in (B) and the riboprobes (cross-hatched boxes) used in RPA analysis reported in (C) and (D).
(B) Semiquantitative RT-PCR demonstrates the presence of MuDR- and hMuDR-derived transcripts in mature embryos of two non-Mutator and two Mutator lines. Amplification of α-actin transcripts was included as an internal loading control. Arrowheads indicate the composition of individual products as retaining or lacking individual introns.
(C) RPA analysis to detect mudrB. Three active MuDR stocks show different levels of mudrB transcripts, reflecting MuDR copy numbers from 1 to >20. The position of the fully protected probe is indicated by the arrowhead at right; this corresponds to MuDR region 3782 to 4222 (see Table 2). Yeast RNA hybridized to the riboprobe and subsequently unprocessed (−) or processed (+) with the mixture of RNases served as an internal control.
(D) RPA analysis to detect hmudrB using probe 4298 to 4496, which is specific for a subset of homologs (see Tables 1 and 2). Other annotations are as in (C).

