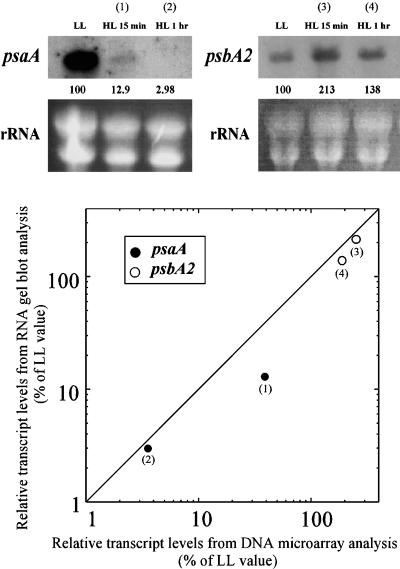
Figure 2.
Comparison of the Results Obtained by DNA Microarray Analysis and RNA Gel Blot Analysis.
The top panel shows the RNA gel blot analysis of psaA and psbA2 transcripts under LL and HL conditions. Values below the blots show the relative levels of transcripts expressed as a percentage of values under LL conditions. The profile of rRNAs stained with ethidium bromide is shown as a control for equal RNA loading. The bottom panel shows the correlation between the relative transcript levels obtained by DNA microarray analysis and RNA gel blot analysis. The same RNA sample was used for the DNA microarray analysis and the RNA gel blot analysis.

