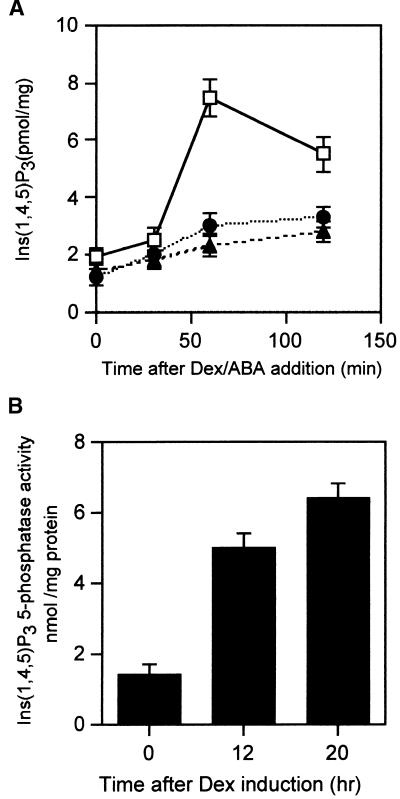
Figure 5.
Analysis of Ins(1,4,5)P3 Levels and Ins(1,4,5)P3 5-Phosphatase Activity in Transgenic Lines.
(A) Changes in Ins(1,4,5)P3 levels in transgenic lines expressing the AtPLC1 antisense and AtIP5PII sense transgenes in response to ABA. Fourteen-day-old transgenic seedlings were transferred to a hydroponic system (Aoyama and Chua, 1997) for 2 days before the addition of fresh medium containing Dex (30 μM) or ABA (50 μM) or both. Plants were collected at 0, 30, 60, and 120 min after ABA addition, and the amount of Ins(1,4,5)P3 was determined as described in Methods. Vector control transgenic plants contained the pTA211 plasmid alone. Open squares, vector control line with ABA (50 μM); closed circles, AtPLC1 antisense line with Dex (30 μM) and ABA (50 μM); closed triangles, AtIP5PII sense line with Dex (30 μM) and ABA (50 μM). Mean values ±sd are provided for three independent induction experiments.
(B) Ins(1,4,5)P3 5-phosphatase activity in transgenic lines expressing the Dex-responsive AtIP5PII sense transgene. Fourteen-day-old transgenic seedlings were transferred to a hydroponic system (Aoyama and Chua, 1997) for 2 days before the addition of fresh medium containing Dex (30 μM). Plants were collected from different lines at 0, 14, or 20 hr after Dex addition, and Ins(1,4,5)P3 was assayed as described in Methods. Vector control lines displayed only background levels upon the addition of Dex (0-hr time point; data not shown). Each bar represents the average value of three independent induction experiments with standard deviations.

