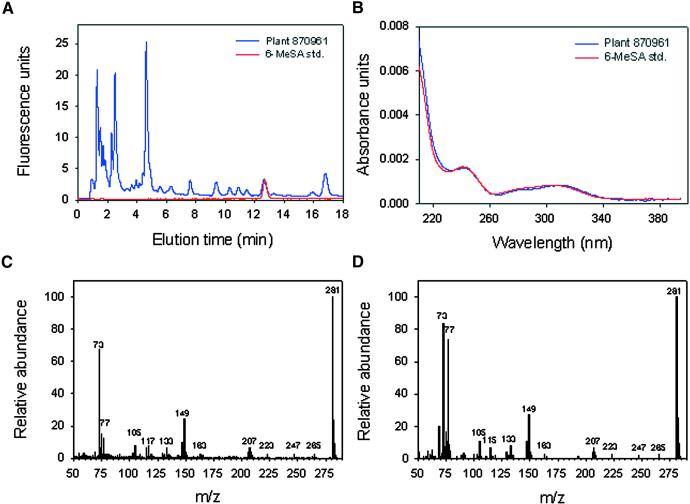
Figure 4.
Identification of 6-MeSA in 6MSAS Tobacco.
(A) HPLC fluorescence chromatogram of a leaf extract from plant 870,961 (blue trace) and the 6-MeSA standard (std.; red trace).
(B) UV light absorption spectrum of a leaf extract from plant 870,961 (blue trace) and the 6-MeSA standard (std.; red trace).
(C) Gas-liquid chromatography–mass spectroscopy analysis of a trimethylsilylated leaf extract from plant 870,961. m/z, mass-to-charge ratio.
(D) Gas-liquid chromatography–mass spectroscopy analysis of the trimethylsilylated 6-MeSA standard. m/z, mass-to-charge ratio.

