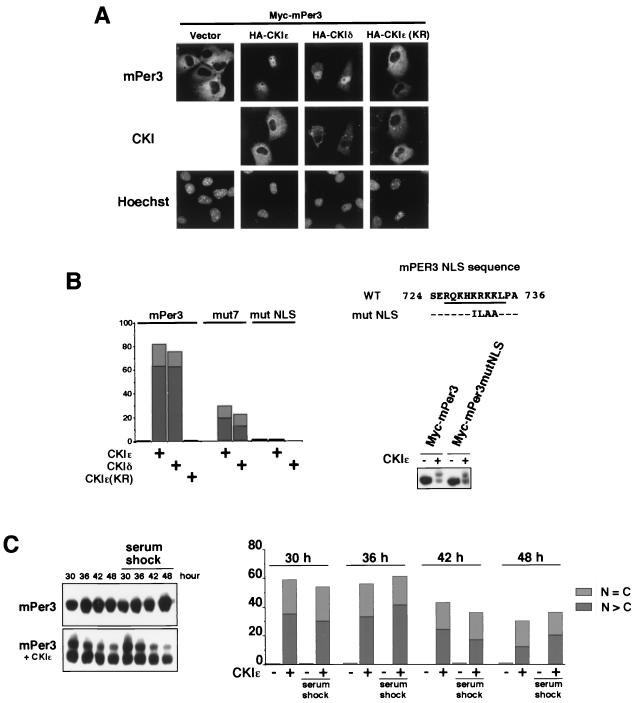
FIG. 6.
CKI-induced nuclear translocation of mPer3 depends on CKI-mediated phosphorylation and NLS of mPer3. (A) Myc-tagged mPer3 was expressed in COS7 cells, together with or without HA-tagged CKIɛ, CKIδ or CKIɛ(KR). The cells were fixed and incubated with primary antibodies (anti-Myc antibody [9E10] and anti-HA polyclonal antibody) and then with the appropriate secondary antibodies. The cells were examined by using a Zeiss Axiophoto. (B, left panel) Myc-tagged mPer3, mut7, or mutNLS (see the right panel) (0.9 μg of DNA) was expressed in COS7 cells, together with or without HA-tagged CKIɛ, CKIδ, or CKIɛ(KR) (0.1 μg of DNA). After being stained, the cells were classified into three categories in terms of location of Myc-tagged mPer proteins as nucleus (N > C), cytoplasm (N < C), or both nucleus and cytoplasm (N = C). The classifications “N > C” and “N = C” are indicated by dark gray and light gray boxes, respectively. More than 150 cells were examined, and the percentages of N > C and N = C are shown. Experiments were performed twice with similar results. (B, right panel) A PCR-generated mutation was made in a presumable mPer3 NLS (mutNLS) and compared to the wild-type (WT) sequence. WT mPer3 or mPer3mutNLS was expressed in COS7 cells, together with or without CKIɛ. The cell extracts were subjected to immunoblotting with anti-Myc antibody (A-14). (C) The cells were subjected to transfection and kept in a medium containing 1% serum, after the serum shock (50% for 2 h). Myc-tagged mPer3 was expressed in COS7 cells, together with or without CKIɛ. The cells were then lysed (or fixed for staining) 30, 36, 42, and 48 h after the serum shock (time = 0 h). In the left panel, cell extracts were subjected to immunoblotting with anti-Myc antibody (A-14). The electrophoretic retardation of the mPer3 protein bands results from phosphorylation. In the right panel, cells were classified after being stained into three categories with regard to the location of Myc-tagged mPer3: N > C, N < C, or N = C. The N > C and N = C classifications are indicated by dark gray and light gray boxes, respectively. More than 250 cells were examined, and the percentages of the N > C and N = C groups are shown.

