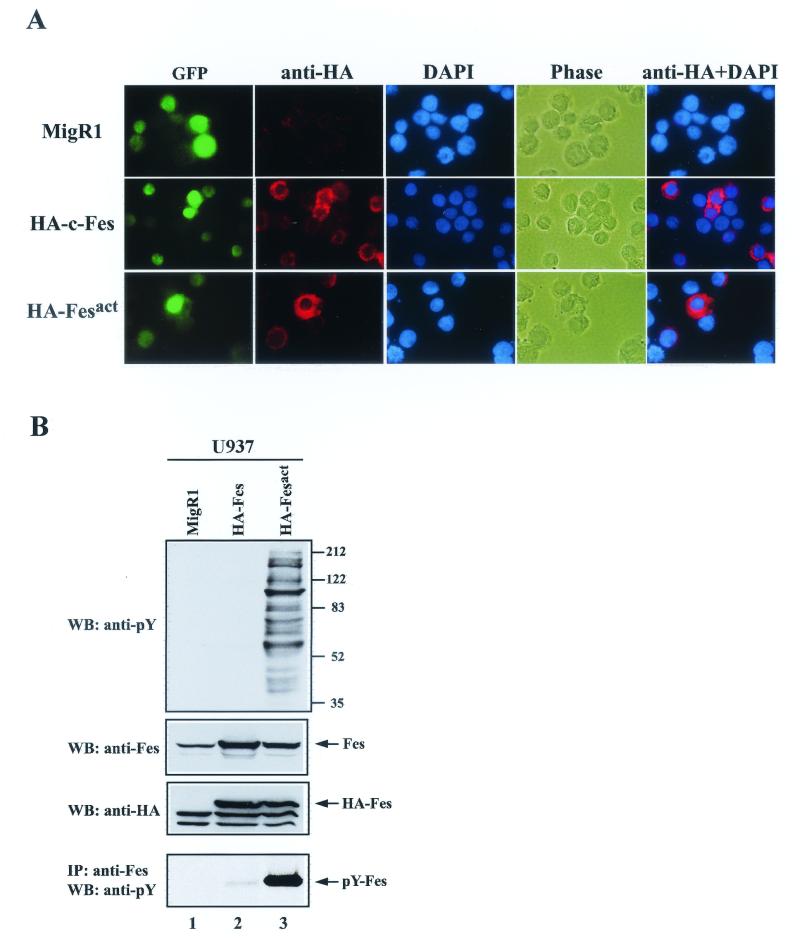
FIG.2.
Coexpression of Fes and GFP in infected cells and tyrosine phosphorylation of cellular proteins by active Fes. (A) U937 cells infected with MigR1 vector, MigR1 HA-c-Fes, or MigR1 HA-Fesact were stained 4 days after infection by sequential incubation with biotinylated anti-HA antibody and Alexa Fluor 594-conjugated streptavidin. The nuclei were stained with DAPI. In the final column, the images from anti-HA antibody and DAPI staining were merged. Cells were observed by fluorescence microscopy (magnification, ×63). HA, hemagglutinin tag. (B) U937 cells infected with MigR1 vector (lane 1), MigR1 HA-c-Fes (lane 2), or MigR1 HA-Fesact (lane 3) were lysed 3 days after infection. The cell lysates were analyzed by SDS-PAGE in 8.5% gels followed by immunoblotting (WB) with the indicated antibodies, either directly or after immunoprecipitation (IP) with anti-Fes antibodies. The first, second, and third panels correspond to immunoblots of total cellular proteins detected with antiphosphotyrosine, anti-Fes, and anti-HA antibodies, respectively. In the fourth panel, the cell lysates were immunoprecipitated with anti-Fes antibody, and the immunoprecipitates were analyzed by SDS-PAGE followed by immunoblotting with antiphosphotyrosine antibodies. Numbers at the right indicate the positions of molecular weight (MW) markers. The arrows indicate the positions of Fes proteins, which have an apparent molecular mass of 92 kDa.

