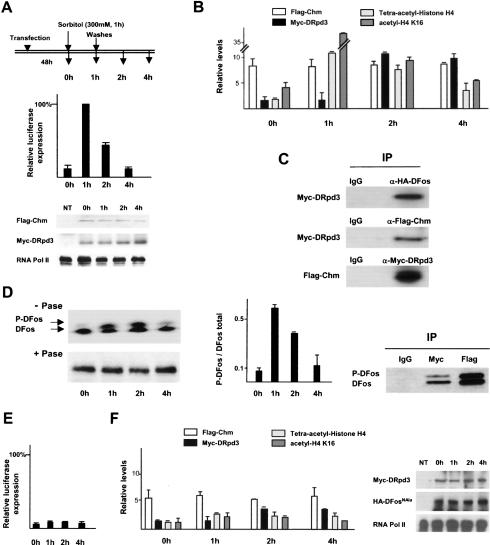
Figure 7.
Chm and DRpd3 recruitment and function upon JNK signaling activation and deactivation. (A–C) Compilation of data obtained from RT–PCR, ChIP, and Western blot analyses during JNK signaling activation and inhibition upon sorbitol addition (300 mM for 1 h) and removal in HEK293 cells transfected with HA-DFos, Flag-Chm, and Myc-DRpd3. (A, top) At each time point described, total RNA was harvested for RT–PCR to access luciferase transcription, and chromatin extract was prepared for ChIP analyses. (Middle) luciferase transcription. (Bottom) Control Western blots of cell extracts for Chm and DRpd3 expression, and RNA pol II as a loading control. (NT) Nontransfected cells. (B) ChIP with anti-Flag, anti-Myc, anti-tetra-acetylated H4, and anti-acetyled H4K16 antibodies. RT–PCR data are normalized relative to GAPDH expression. ChIP data are depicted as relative levels compared with transfection with the reporter alone (average of three independent assays). (C) Western blots, probed for proteins indicated to the left, of proteins associated with chromatin fragments extracted 1 h after sorbitol removal and immunoprecipitated by antibodies to Flag (Chm), Myc (DRpd3), or HA (DFos). (D, left) Phosphorylation status of chromatin-bound HA-DFos was assessed by Western blot of chromatin samples probed by anti-HA. +Pase and –Pase refer to chromatin samples digested or not with calf intestinal alkaline phosphatase. (Middle) Time course upon sorbitol addition and removal of P-DFos/total DFos ratio obtained by phosphoimager gel scan. (Right) Western blot for DFos and P-DFos of chromatin fragments extracted 1 h after sorbitol removal and immunoprecipitated by Myc-DRpd3 and Flag-Chm. (E,F) Compilation of data obtained from similar experiments as in A and B, but using HA-DFosNAla instead of HA-DFos (average of four independent assays). (Right) Western blots of cell extracts for DRpd3, DFosNAla, and RNA pol II.

