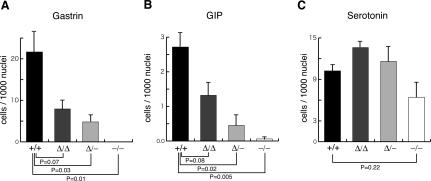
Figure 6.
Frequency of gastrin- and GIP-producing cells as a function of Pdx1 genotype. Sections analyzed were E18.5 for GIP- and serotonin-producing cells, and P7 for gastrin-producing cells. Results are from analyzing three mice of each genotype (see Materials and Methods for tissue sampling protocol). The Y-axis represents the number of gastrin-, GIP-, or serotonin-producing cells per 1000 epithelial nuclei; data expressed as mean ± SE (n = 3).

