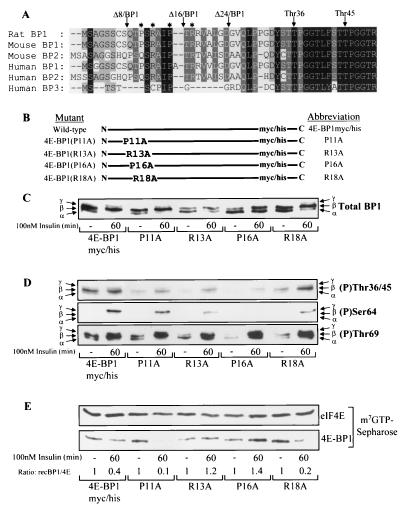
FIG. 5.
4E-BP1 R13A and 4E-BP1 P16A mutants show reduced basal and insulin-stimulated phosphorylation, preventing dissociation from eIF4E. (A) N-terminal sequence homology of 4E-BPs. The Thr36 phosphorylation site and truncations Δ8/BP1, Δ16/BP1, and Δ24/BP1 are shown. ∗, point mutations P11A, R13A, P16A, and R18A. (B) Diagrammatic representation of mutants used. (C) HEK293 cells were transiently transfected with plasmids expressing the mutants shown above, serum starved, and stimulated with insulin where indicated. 4E-BP1 mutants were analyzed using the anti-Myc antibody. (D and E) The cell extracts from panel C were analyzed for 4E-BP1 phosphorylated at Thr36/45 (top), Ser64 (middle), and Thr69 (bottom) (D) or subjected to affinity chromatography on m7GTP-Sepharose as described for Fig. 2C (E), prior to SDS-PAGE and Western blotting as indicated.

