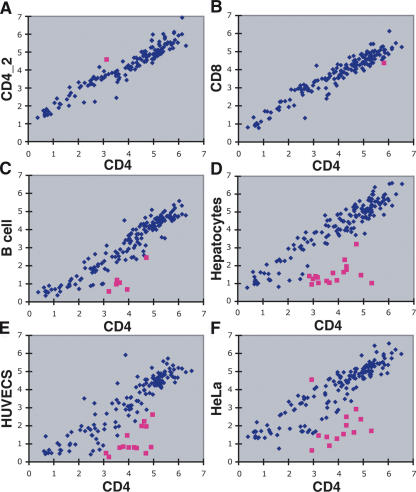
Figure 6.
Cell type specificity of CD4+ T cell-specific DNase HS sites using real-time PCR. Red squares identify “outlier” DNase clusters that were hypersensitive in CD4+ T cells, but not hypersensitive in other cell types. Δ Ct values (both x- and y-axes) mark the relative hypersensitivity of each DNase cluster for each cell type. (A) Two independent CD4+ T cell preparations display that this method is highly reproducible. The single outlier represents rare data points that are >3 SD from the mean. (B) Only one outlier was detected between CD4+ and CD8+ T cells. (C) Five DNase clusters were identified as not hypersensitive in B cells. (D,E,F) Additional DNase clusters were identified as not hypersensitive in hepatocytes, human umbilical vein endothelial cells (HUVEC), and HeLa cells.

