Figure 3.
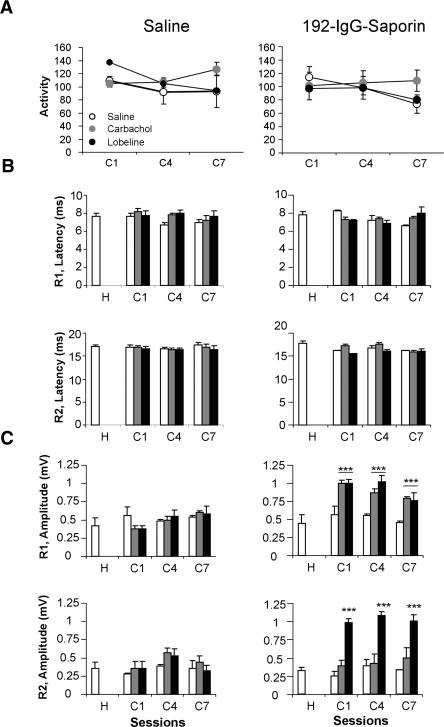
Locomotor activity and blink reflex basic properties in saline- and 192-IgG-saporin-injected rats treated with different cholinergic agonists. (A) Locomotor activity, as indicated by the number of broken beams in a 10-min period, of saline- (left panel) and 192-IgG-saporin- (right panel) injected rats measured 1 h after cholinergic drug administration in selected conditioning sessions. Open circles, saline; gray circles, carbachol; black circles, lobeline. (B,C) Bar diagrams representing the mean ±SEM of the latency (B, in msec) and peak amplitude (C, in mV) of the R1 (upper row) and R2 (lower row) components of blink reflex in saline- (left column) and 192-IgG-saporin- (right column) injected animals 1 h after cholinergic drug administration during habituation and selected conditioning sessions (n = 6 per group). Systemic treatments: saline, white bars; 0.1 mg/kg carbachol, gray bars; 1 mg/kg lobeline, black bars. *, P ≤ 0.05; **, P ≤ 0.01; ***, P ≤ 0.001. Abbreviations on the x-axis refer to (H) habituation or (C) conditioning sessions.

