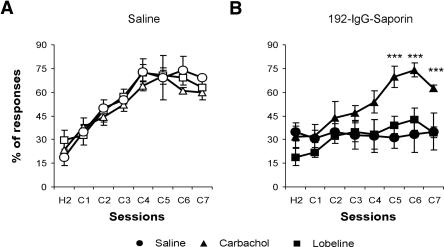
Figure 5.
Learning curves of classically conditioned eyelid responses in saline- and 192-IgG-saporin-injected rats treated with different cholinergic agonists. (A) Learning curves of saline-injected rats treated with saline (○), 0.1 mg/kg carbachol (▵), or 1 mg/kg lobeline (□). (B) Learning curves of 192-IgG-saporin-injected rats treated with saline (•), 0.1 mg/kg carbachol (▴), or 1 mg/kg lobeline (▪). *, P ≤ 0.05; **, P ≤ 0.01; ***, P ≤ 0.001 (n = 6 rats per group). Abbreviations on the x-axis refer to (H) habituation or (C) conditioning sessions.

