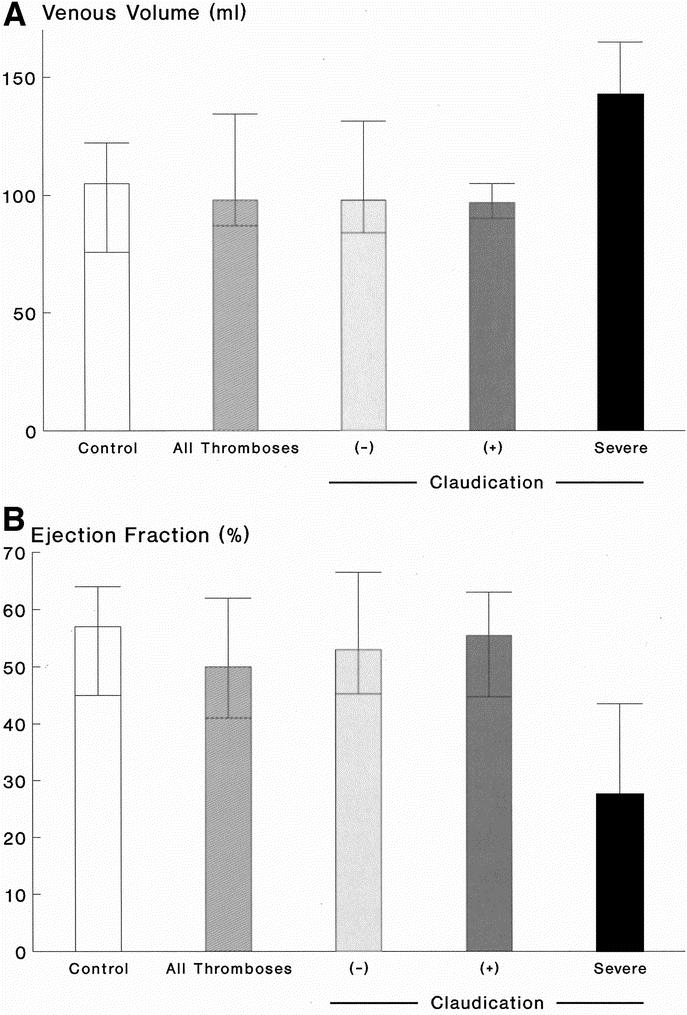
FIGURE 3. A: Venous volume [VV] (mL) in 37 control limbs and 41 limbs with prior I-FDVT (P = 0.27), on the left. On the right, the limbs with prior I-FDVT are subdivided into those with (+) and without (–) claudication, and those with severe claudication compelling cessation of walking; differences among the three subgroups were not significant (P = 0.58). Data are expressed as median and interquartile ranges. B: Ejection fraction [EF] (%) in 37 control limbs and 41 limbs with prior I-FDVT (P = 0.13), on the left. On the right, the limbs with I-FDVT are subdivided into those with (+) and without (–) claudication, and those with severe claudication compelling cessation of walking; differences among the three subgroups were significant overall (P = 0.014) [(–) vs. severe, P = 0.003; (+) vs. severe, P = 0.016]. Data are expressed as median and interquartile ranges.
