
Figure 2.
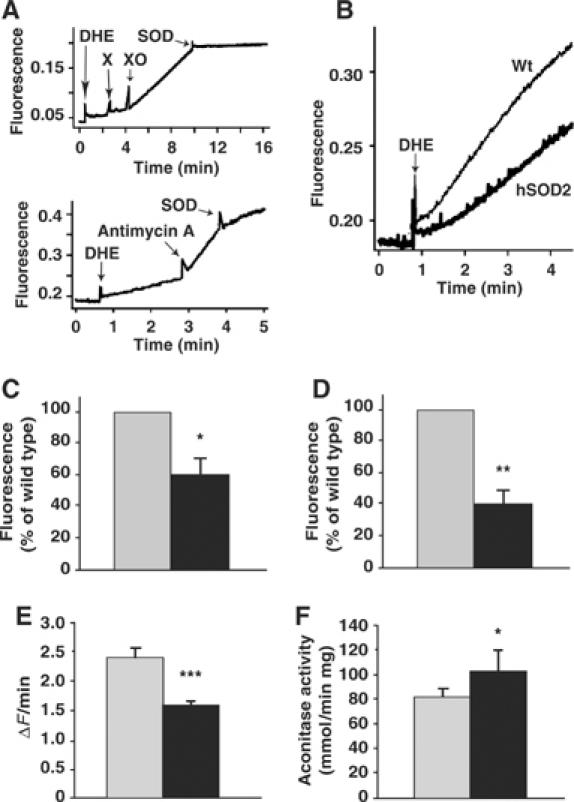
Superoxide measurements. (A) Validation. Upper panel: Chemical validation. Sequential addition of 63.5 μM DHE, 375 μM xanthine (X), 5 μg/ml xanthine oxidase (XO) and 68 U/ml recombinant SOD was performed and fluorescence emission was followed. Lower panel: Biological validation. Mitochondria, 0.5 mg, from skeletal muscle were incubated with 5 mM succinate, 2 μg/ml oligomycin and 3.3 μg/ml rotenone followed by addition of 63.5 μM DHE. Further additions of 0.8 μg/ml antimycin A and of 24 U/ml recombinant SOD were made. (B) Mitochondria, 0.5 mg, from skeletal muscle (as in B) were incubated under conditions of reverse electron flow using 5 mM succinate and 2 μg/ml oligomycin followed by addition of 63.5 μM DHE. (C) Quantification of the change in fluorescence signal intensity over time under conditions of reverse electron flow as exemplified in (B). The rate of superoxide release was calculated as the change in fluorescence intensity during the linear response after addition of DHE. The y-axis denotes the rate of superoxide release in PAC662D1 mitochondria (black bar) relative to wild-type mitochondria (gray bar) and is given in percentage. The values represent the means±s.e.m. (n=3 independent mitochondrial preparations, each analyzed in triplicate). (D) The rate of superoxide release from brown fat mitochondria under conditions similar to those in (B) but with 5 mM glycerol-3-phosphate as substrate and 3.3 μg/ml rotenone. Other conditions (e.g. presence/absence of GDP or rotenone) yielded similarly decreased superoxide release rates in the SOD2-overexpressing mitochondria (not shown) (n=3 independent mitochondrial preparations, each analyzed in triplicate). (E) Superoxide measurements of PAC662D1 (black bar) and wild-type (gray bar) MEF. MEF were incubated in Dulbecco's modified Eagle's medium (DMEM) containing 10 μM DHE. The change in fluorescence signal intensity of each cell was monitored online by confocal microscopy. For statistical analyses, data from six separate experiments were pooled. The values represent the means±s.e.m. (hSOD2, n=198; wild type, n=201). (F) Aconitase enzyme activity measurements in PAC662D1 (black bar) and wild-type skeletal muscle mitochondria (gray bar). The values represent the means±s.e.m. (n=5).