
Figure 1.
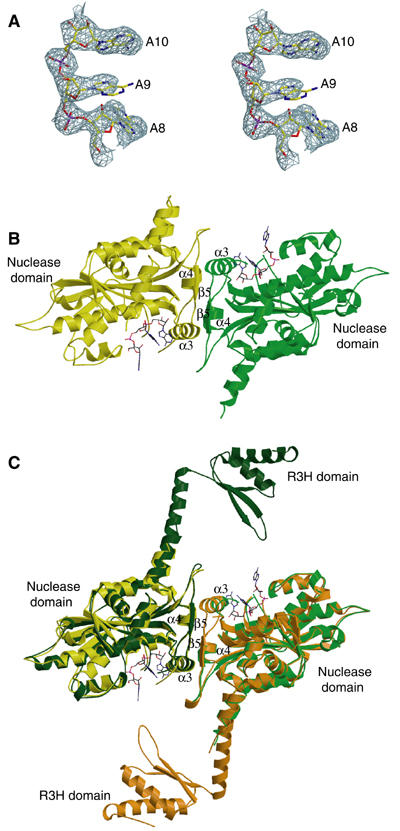
Structures of PARNn in free and RNA-bound forms. (A) Stereo diagram of 2.6 Å simulated annealing (SA) omit map contoured at 2σ covering the bound poly(A) in the PARNn–RNA complex. The last three nucleotides are shown in stick model. (B) A ribbon diagram of the PARNn–RNA complex. The two molecules are shown in yellow and green, respectively. Nucleotides are shown in stick model. α3, α4 and β5 are labeled in (B, C). (C) Superimposition of the PARNn–RNA complex with native PARNn. The color coding for the PARNn–RNA complex is as in (B). The two molecules (chain A and chain B) of native PARNn are highlighted with dark green and orange, respectively. Nucleotides are shown in stick model.