
Figure 2.
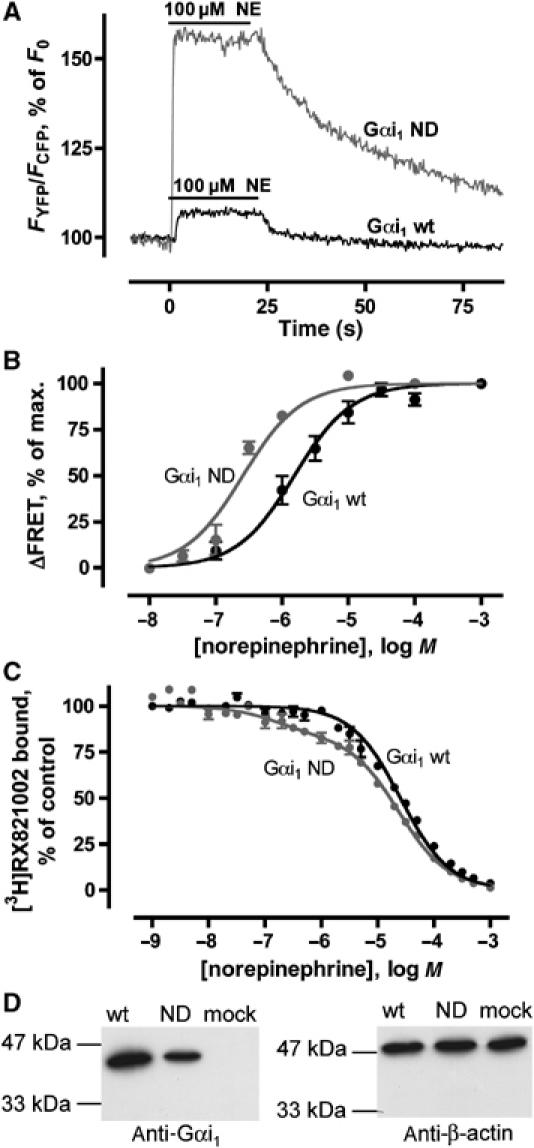
α2A-YFP interaction with wild-type Gαi1 and Gαi1ND. (A) FRET signals of individual cells in response to 100 μM NE (bar) with wild-type (black curve) and ND mutant (gray curve) Gαi1 coexpressed with α2A-YFP and Gβ1 CFP-γ2 (n=5, representative recording shown). (B) Concentration–response curves of receptor/G protein interaction for wild-type (black) and ND mutant (gray) (n=5–8) Gαi1 were determined by measuring amplitudes of FRET changes as in panel A after stimulation with different concentrations of NE. FRET responses following stimulation with 1 mM NE were set to 100%. (C) In membranes prepared from cells expressing α2A-YFP, Gβ1 CFP-γ2 and wild-type Gαi1 or Gαi1ND, high-affinity agonist binding sites were determined by competing for [3H]RX821002 binding with NE (n=3 each). Competition binding data for wild-type Gαi1 (black) were fitted best by a monophasic curve (Ki=21±1.8 μM), while a biphasic fit was significantly better (F-test) for Gαi1ND (gray; Ki,high=95±70 nM, Ki,low=17±0.8 μM, 16% high-affinity sites). (D) Western blot analysis of expression levels of HEK293T cells transfected with wild-type Gαi1 (wt) or Gαi1ND (ND); β-actin was determined in the same samples as control (n=3, representative experiment shown). Cells not transfected with Gαi1 were also analyzed (mock).