
Figure 4.
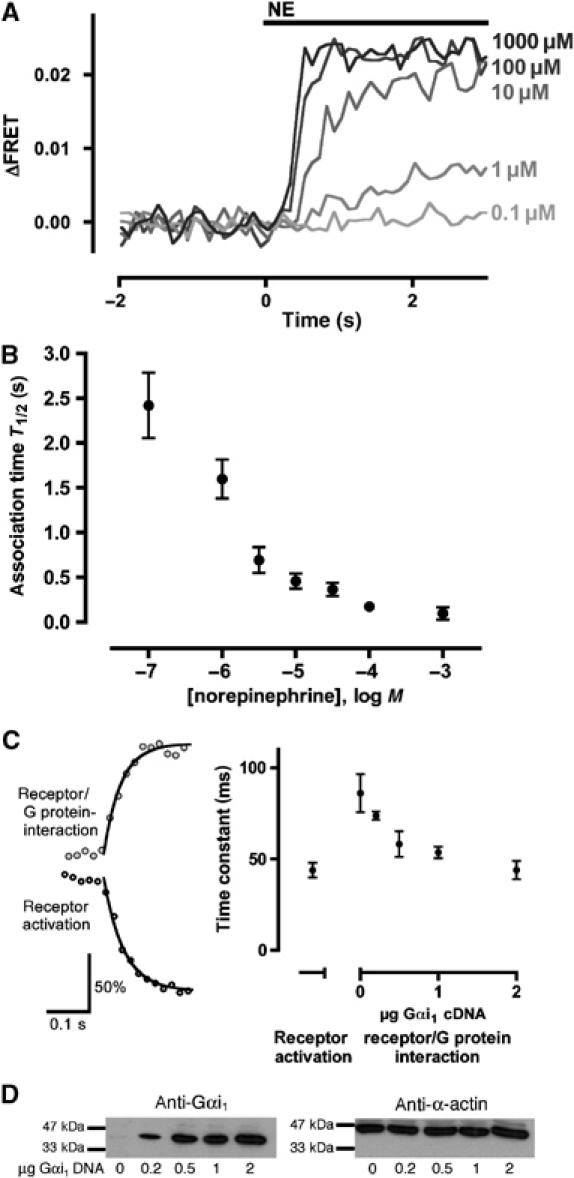
Kinetics of the α2A-adrenergic receptor/Gi interaction. (A) Cells transfected with α2A-YFP and Gαi1β1 CFP-γ2 were superfused with different NE concentrations. Activation traces of the same cell after stimulation with different concentrations of NE are shown (representative experiment out of eight). (B) Times required to achieve a half-maximal FRET response (T1/2) are plotted as a function of agonist concentration; P<0.0001 (one-way ANOVA). (C) Kinetics (left) of receptor activation (dark gray; determined with cells expressing the α2A-CFP/YFP; Vilardaga et al, 2003) and receptor/G protein interaction (light gray) after stimulation with 1 mM NE (representative experiments of 8 and 10, respectively). The maximal amplitude of both traces was set to 100%. Averaged time constants (right) were 44±4.0 ms for receptor activation; for receptor/G protein interaction, the time constants depended on the amount of Gαi1 and were 86±10, 74±2.3, 58±7.0, 54±3.1 and 44±5.1 ms for 0, 0.2, 0.5, 1 and 2 μg transfected Gαi1 cDNA, respectively; P=0.0022 for different Gα amounts (one-way ANOVA). (D) Western blot of lysates from cells transfected with α2A-YFP, Gβ1 CFP-γ2 (for amounts, see Materials and methods) and indicated amounts of Gαi1 (left). In the same samples, β-actin was determined as a control.