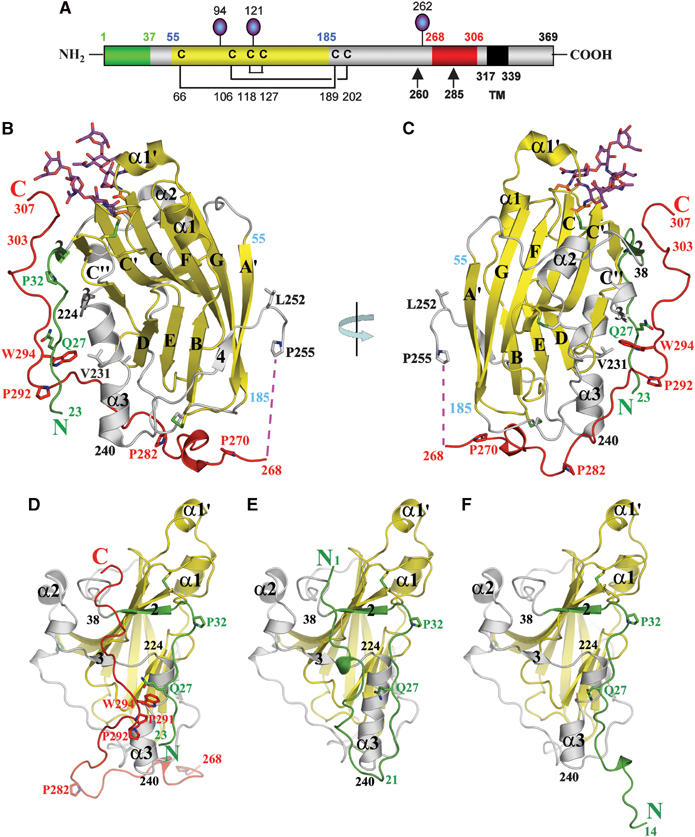
Figure 1.

gD(23–306)307C structure. (A) Schematic representation of HSV-1 gD. Disulfide bonds are shown as black lines and N-linked oligosaccharides as lollipops. Colors of the N-terminal region, forming the HVEM-binding hairpin in the gD285–HVEM complex, the Ig-like core, and the C-terminal region past residue 255 are represented in green, yellow, and red, respectively. Positions of important amino acids and domain boundaries are numbered according to the mature form of gD. TM: transmembrane region. (B) Ribbon representation of the gD(23–306)307C subunit. The secondary structure elements are labeled as in Carfi et al (2001). The color code used is same as in (A). (C) As in (B) after 180° rotation as indicated. (D) Front view of gD(23–306)307C structure. The model is rotated 90° clockwise with respect to panel B to show the front side of gD, where the N- and C-terminal regions interact. (E) Front view of gD285 from the gD285–HVEM complex, with HVEM removed for clarity. (F) Front view of gD285 in the unbound state.
