
Figure 8.
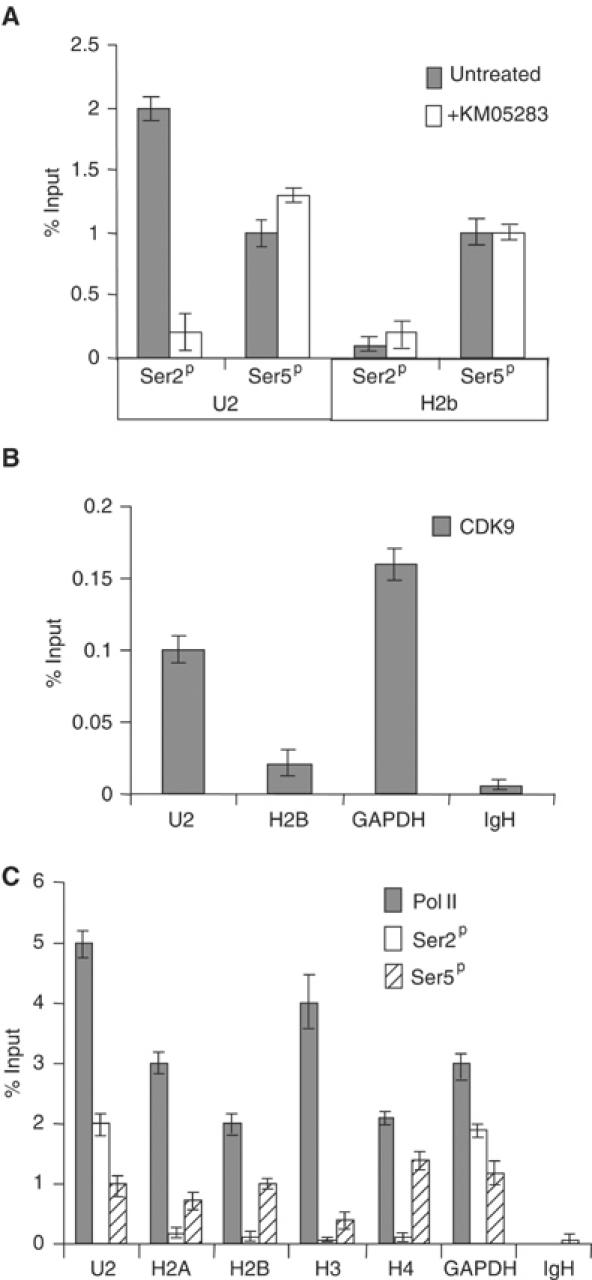
CTD Ser2 phosphorylation and CDK9 are differentially associated with U2 genes and H2b genes. (A) Real-time PCR analysis of the output from ChIP using antibodies against the pol II CTD phosphorylated on Ser2 (Ser2P) (H5, Covance) or Ser5 (Ser5P) (H14, Covance) before and after treatment of cells with KM05283. The graph shows the values obtained using primers against the U2 and H2b genes. Error bars indicate the standard deviation of real-time triplicates in this and subsequent panels. Immunoprecipitation is given as a percentage of the amount of the input DNA after subtraction of the no antibody control in this and subsequent panels. The no antibody controls were less than 0.1% of input DNA. (B) Real-time PCR analysis of the output from ChIP using antibodies against CDK9 (Santa Cruz, L-19). The graph shows the values obtained using primers against the U2, H2b, GAPDH and IgH genes. The no antibody controls were less than 0.008% of input DNA. (C) Real-time PCR analysis of the output from ChIP using antibodies against the large subunit of pol II (Santa Cruz, H-224) and the pol II CTD phosphorylated on Ser2 or Ser5. The graph shows the values obtained using primers against the U2, H2a, H2b, H3, H4, GAPDH and IgH genes. The no antibody controls were less than 0.008% of input DNA for the pol II antibody.