
Figure 4.
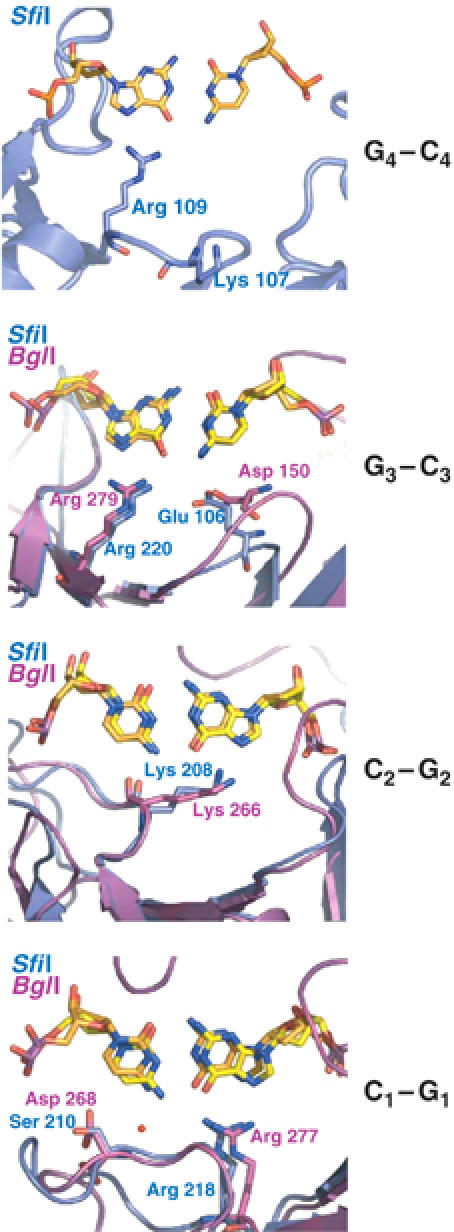
Comparison of base-specific DNA interactions in SfiI and BglI. The proteins are shown in ribbon representation (SfiI in blue and BglI in magenta). The nucleotides (SfiI DNA in orange and BglI DNA in yellow) and the base-specific residues are shown in ‘stick' representation. In each picture, only the base pairs in question are shown; other nucleotides are omitted for clarity.