Figure 5.

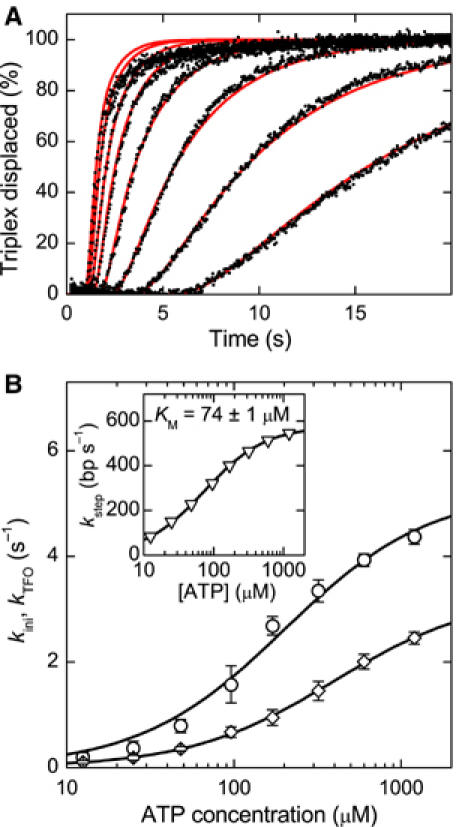
ATP dependence of the reinitiation rate kini. (A) Triple helix displacement profiles for ATP concentrations of (from right to left) 12.5, 25, 48, 96, 170, 320, 600 and 1200 μM (black dots). Reactions were initiated by mixing preincubated triplex DNA, MTase and HsdR with an equal volume of reaction buffer with ATP. The triplex is 479 bp away from the EcoR124I binding site. The final solution contains 30 nM MTase, 120 nM HsdR and 1 nM DNA, of which 0.5 nM carries the triplex. As the ATP concentration is increased, the profiles become faster. The red lines are fits to the data (see Supplementary data). (B) Initiation rate kini and triplex displacement rate kTFO versus ATP concentration as obtained from fitting the triplex displacement profiles. Note that the fitting procedure does not distinguish between kini and kTFO (see text and Supplementary data). From Michaelis–Menten fits, a maximum rate kMax,1=5.2±0.3 s−1 and a KM,1=200±30 μM is obtained for the first data set (open circle) and a kMax,2=3.3±0.1 s−1 and a KM,2=400±20 μM for the second data set (open diamonds). Thus, kini at saturating ATP is between 3.2 and 5.5 s−1. The inset shows the ATP dependence of the translocation rate. A maximum translocation rate of kstep,max=576±2 bp s−1 and a KM=74±1 μM is obtained from a Michaelis–Menten fit of the data.
