
Figure 6.
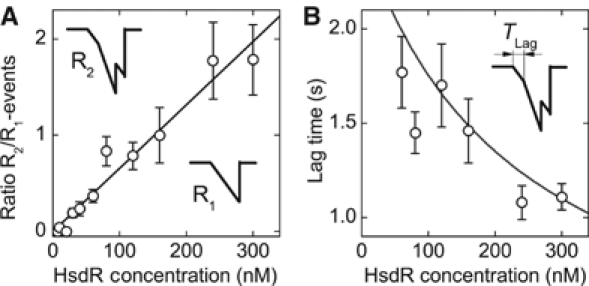
R2-complex formation and its dependence on the HsdR concentration. (A) Ratio between R2- and R1-events versus HsdR concentration. The insets in the graph illustrate the classification of each event type. The straight line in the graph is a linear fit to the data with a reciprocal slope of 152±8 nM. At this concentration, there are, on average, as many R1-events as R2-events. (B) Lag time versus HsdR concentration. The lag time is defined as the time it takes the second motor to establish translocation activity after the first motor started to translocate (illustrated in the inset). The solid line is plotted without adjustable parameters according to Tlag=(kR2,2cHsdR+koff,R1)−1 (see text).