
Figure 8.
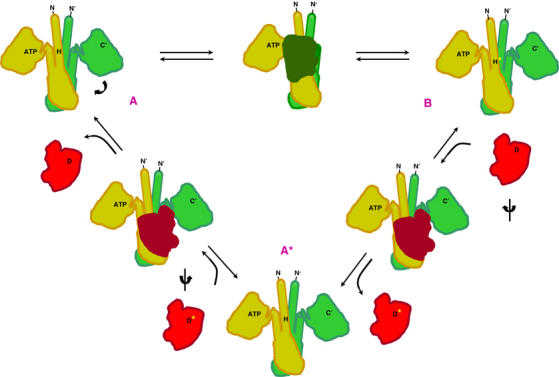
Structure-based schematic of the reactions catalyzed by HK sensors. The kinase autophosphorylation (A → B), phosphotransferase (B → A*) and phosphatase (A* → A) activities are shown on projected outlines of the enzyme and protein–substrate models. Positions of N and C termini, ATP and the phospho-accepting histidine (H) are indicated on an HK dimer (orange and green). Position of phospho-accepting aspartate (D) is indicated on a RR (red). The transferred phosphoryl group is indicated as a yellow asterisk.