
Figure 2.
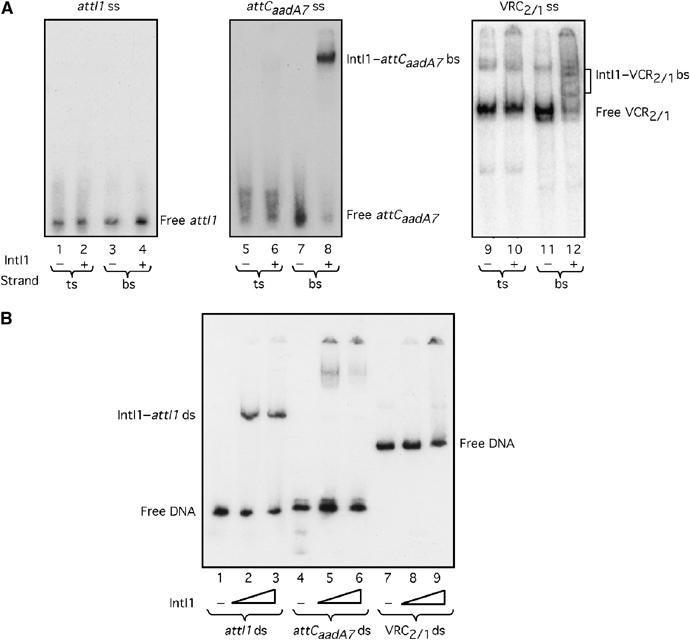
Gel retardation of ss or ds attI1, attCaadA7 and VCR2/1 by IntI1. (A) Single strand substrates. A 4.8 pmol portion of IntI1 was incubated with 0.5 pmol of ssDNA containing the ts or the bs of attI1, attCaadA7 or VCR2/1. Lanes 1–4 show the attI1 ts or bs binding study; lanes 5–8 correspond to the attCaadA7 ts or attCaadA7 bs binding study; the last four lanes (9–12) show the VCR2/1 ts or VCR2/1 bs binding study. (B) Double strand substrates. Lanes 1, 2 and 3 correspond to incubation of 0, 24 or 48 pmol of IntI1 with ds attI1, respectively; lanes 4, 5 and 6 correspond to incubation of 0, 24 or 48 pmol of IntI1 with ds attCaadA7, respectively; lanes 7, 8 and 9 correspond to incubation of 0, 24 or 48 pmol of IntI1 with ds VCR2/1, respectively.