
Figure 5.
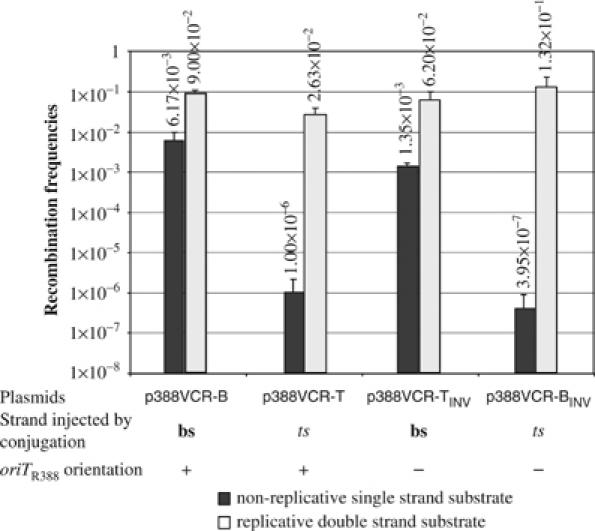
Recombination frequencies of the VCR2/1 site obtained with the R388-based suicide conjugation assay. For a given substrate, the black bar indicates the recombination frequencies established in the in vivo recombination assay with non-replicative ss substrate and the light gray bar the corresponding value in the recombination control assay in replication permissive conditions, as described in Materials and methods. Recombination frequencies (vertical axis of histogram) correspond to the average of three independent trials. Error bars show standard deviations. For clarity, the recombination site, the strand—bs (bottom) or ts (top)—injected by conjugation and the type and orientation (+) and (−) of the oriT are indicated below plasmid names.