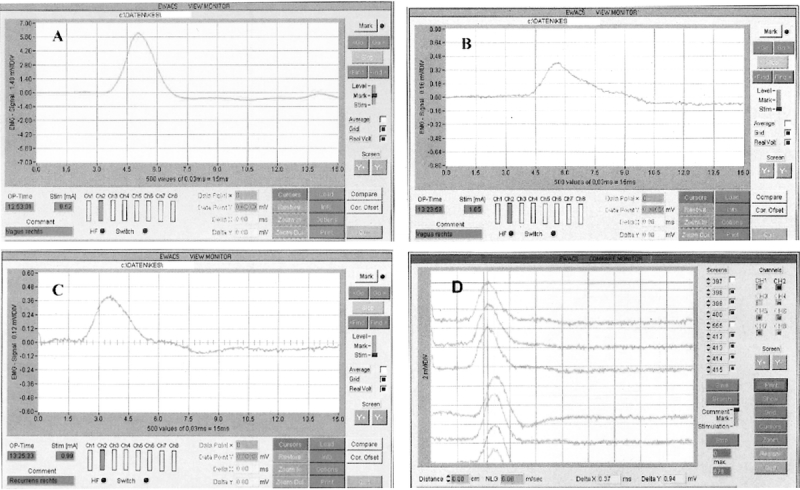
FIGURE 3. Electrical field responses in a patient presenting with preoperative vocal cord palsy (A–C) and a patient with normal pre- and postoperative vocal cord function (D). A and B, Original trace recorded after stimulation of the right vagus nerve with 0.5 mA (A) and 1 mA (B). The interval between the 2 recordings is about 30 minutes. Despite the higher current used in B, the amplitude of the electrical field response is lower than in A because the patient was administered a skeletal muscle relaxant in between (10 mg atracurium). C, Electrical field response to stimulation of the right recurrent laryngeal nerve. Note that the lag between stimulation (time point = 0 milliseconds) and electrical field response is shorter than in B (or A): after vagal stimulation, the delay is about 2 milliseconds longer, and this difference can be used to estimate the nerve conduction velocity (∼15 cm/2 milliseconds ≅ 75 m/s). D, Electrical field responses were elicited by stimulating the right laryngeal nerve of a patient with normal pre- and postoperative vocal cord function. Consecutive original traces are superimposed; the upper 3 traces are 3 consecutive recordings obtained by stimulation at a site above the crossing point of the inferior thyroid artery. The electrode was moved about 3 cm (ie, below the inferior thyroid artery) and 4 consecutive traces were recorded; the 2 vertical lines were drawn to illustrate the difference in time-to-peak of the electrical field responses. This difference (= 0.37 milliseconds) can be used to estimate the nerve conduction velocity (∼3 cm/0.37 milliseconds ≅ 81 m/s).
