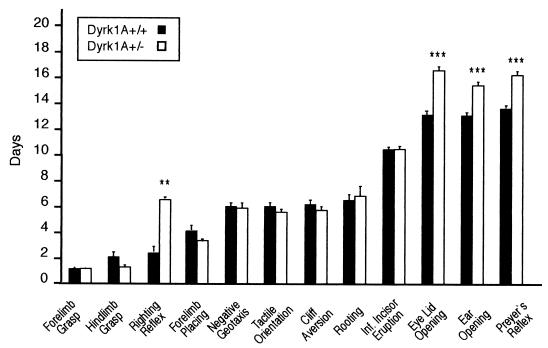
FIG. 6.
Preweaning neurobehavioral analysis. Bars represent mean PDs for the emergence of physical landmarks or the achievement of mature responses in reflexological and behavioral tasks. **, P < 0.001 by Student's t test; ***, P < 0.0001 by Student's t test. Error bars, standard errors. Inf, inferior.

