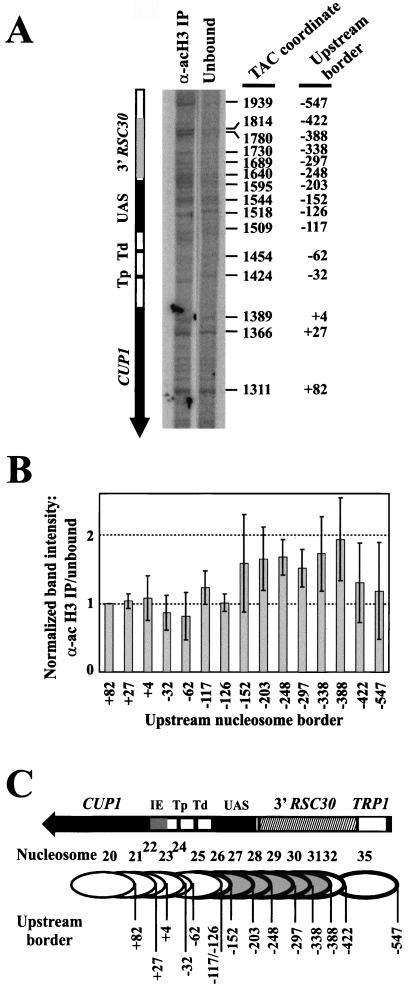
FIG. 4.
Nucleosomes containing CUP1 UASs and sequences farther upstream are the targets for H3 acetylation. (A) Identification of positioned nucleosomes enriched in the acetylated H3 IP obtained with copper-induced TAC from WT cells: monomer extension of nucleosomes in the IP with those in the unbound fraction. A phosphorimage is shown (the exposures of the two lanes are slightly different tofacilitate comparison). The size of each band equals the distance of the farthest border of a positioned nucleosome from the unique SspI site. The coordinates of each border with respect to the HindIII site in TRP1 are given at right (42), and the coordinates with respect to the major upstream start site of CUP1 (+1) are given at far right. Tp, proximal TATA box; Td, distal TATA box. (B) Quantitative analysis of nucleosomes in the acetylated H3 IP (data in panel A). The intensities of the bands in each monomer extension track were normalized to the band at +82 (in the CUP1 ORF), and the ratio of the normalized band in the IP to the normalized band in the unbound fraction was calculated for each nucleosome. (A ratio of 1.0 indicates that this nucleosome is not enriched in the IP.) Error bars represent the standard error for data from four independent experiments. Coordinates are given with respect to the major upstream start site (+1). (C) Schematic showing nucleosomes targeted for H3 acetylation. Nucleosomes are numbered as in Fig. 1B; upstream borders are indicated. Nucleosomes enriched in the IP are shown shaded. The bands at −117 and −126 both derive from nucleosome 25. Nucleosomes 33 and 34 were quantitatively minor and are not included in the analysis.

