
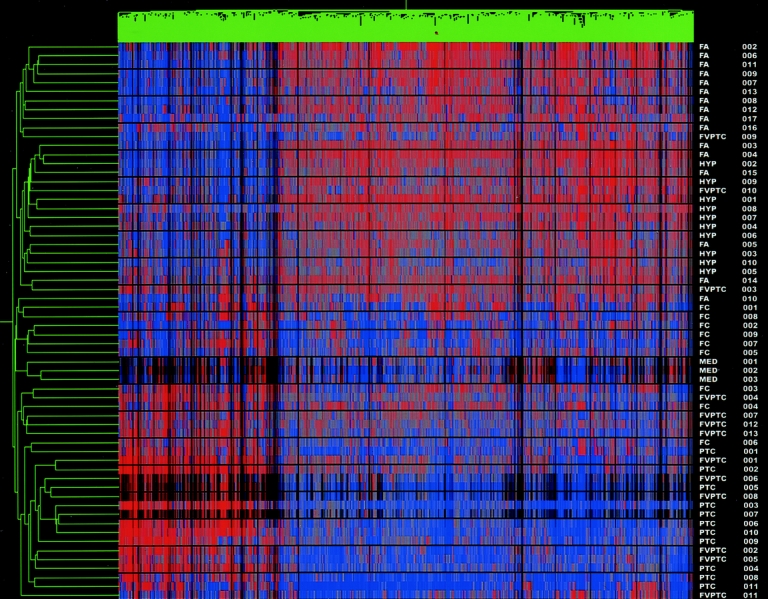
FIGURE 3. Cluster analysis of all samples (including MTC). Dendrogram cluster analysis of all 62 thyroid tumor samples, including the 3 medullary thyroid carcinomas, based on the pattern of expression of 627 differentially expressed genes. All 3 MTC clustered tightly together within the malignant group cluster. Red denotes relative overexpression of a gene; blue relative underexpression of a gene. The sample names are located at the right of the diagram.