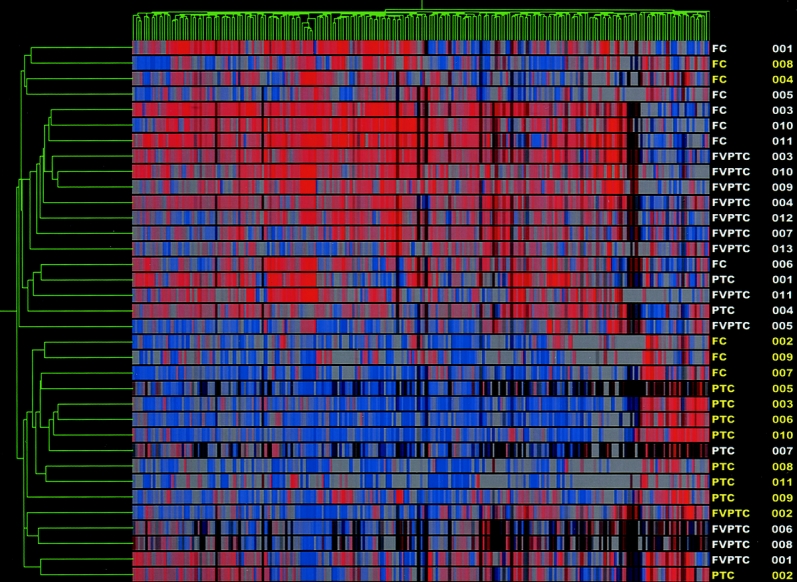
FIGURE 4. High-risk versus low-risk cluster analysis. Dendrogram cluster analysis of 35 thyroid carcinoma samples (14 high risk and 21 low risk) based on the pattern of expression of 339 differentially expressed genes. High risk tumors are highlighted in yellow.
