
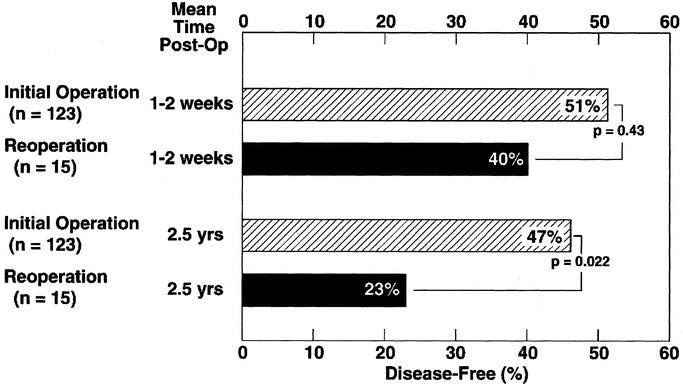
FIGURE 4. Comparison of the disease-free rate after initial surgical exploration and after reoperation for recurrent tumor. Plotted are the disease-free rates within 1 to 2 weeks of surgery and at a follow-up of at least 2.5 years. Results are plotted from data11 for initial surgery in 123 patients, and for reoperation195 in 15 patients