
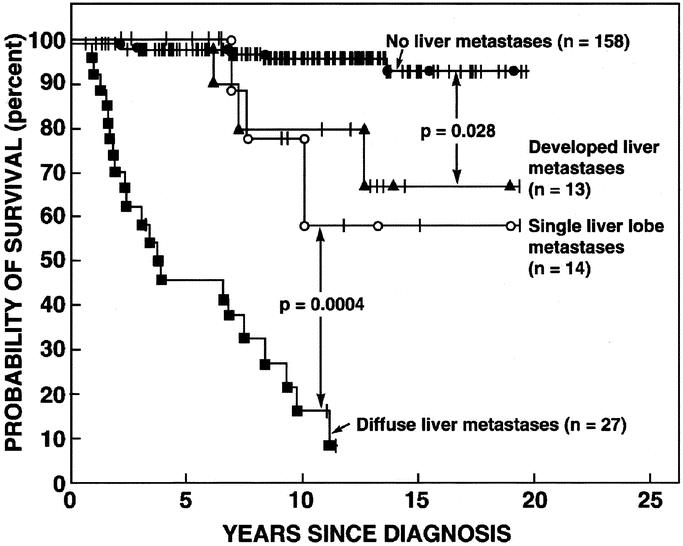
FIGURE 5. Effect of the extent of liver tumor on the survival of 212 patients. Disease-related survival is shown plotted in the form of Kaplan and Meier. Numbers in parenthesis refer to the number of patients in each group. Figure is drawn from the data in Yu et al.24