FIG. 3.
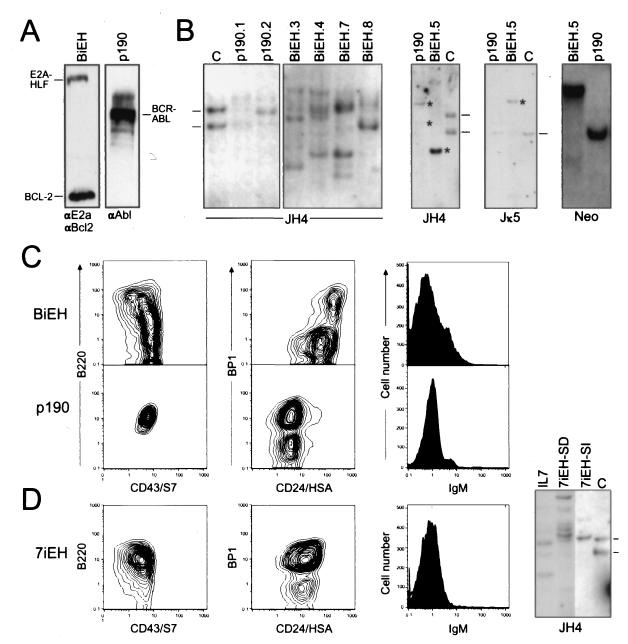
Transgene expression, genotypes, and phenotypes of transduced cells. (A) Western blot analysis of total cellular proteins isolated from cells growing in bone marrow cultures initiated with BiEH (left lane) or p190 (right lane). Antibodies are indicated below the gel lanes. (B) Southern blot analysis of genomic DNA isolated from transduced cells. Sources of DNA are indicated above the respective gel lanes. Identities of DNA probes are denoted below the panels. DNA was digested with XbaI for Ig gene analyses. Retroviral integration patterns were analyzed by using BamHI, which cleaves the proviruses once, allowing detection of DNA fragments whose size varies with the site of integration. (C) Flow cytometric analysis of surface antigen expression by cells growing in representative bone marrow cultures transduced by BiEH (upper row) or p190 (lower row). (D) Flow cytometric and Southern blot analyses for bone marrow cultures initiated by cells transduced with 7iEH.

