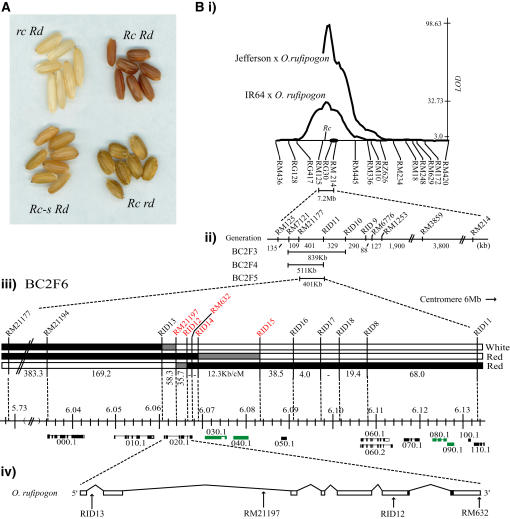
Figure 1.
Phenotypes and Fine-Mapping of Rc.
(A) Rc allele phenotypes. Top row, left to right: seeds from cv Jefferson and O. rufipogon; bottom row, left to right: seeds from Surjamkuhi and H75.
(B) Fine mapping. (i) QTL log of the odds (LOD) plot (y axis) and marker order (x axis). The black oval indicates the position of the centromere; Rc indicates the map position of Rc. (ii) Progress made narrowing the QTL by generation. (iii) Scheme of genotypes for three recombinant classes. Black bars represent DNA from the O. rufipogon parent, white bars represent DNA from the cv Jefferson parent, and gray bars represent an interval containing a break point between cv Jefferson and O. rufipogon DNA. White or red indicates the color of the pericarp conditioned by each class. The ruler shows where the markers and break points are positioned along the psuedomolecule for chromosome 7, and the numbers indicate megabase pairs. Markers that bracket or are included in the 18.5-kb target region are shown in red. The Institute for Genomic Research (TIGR) gene models are shown below the ruler, and numbers indicate the last digits of the gene identifiers, where all begin with LOC_Os07g11_. Transposable elements (TEs) are shown in green. Alternative splice variants are indicated by gene names ending with .1 and .2. The last four genes are staggered for clarity of presentation. (iv) The bHLH gene model, predicted from the O. rufipogon sequence, is enlarged to show the location of intragenic markers (indicated with arrows). The bHLH domain is indicated by black boxes at the end of exon 6 and the beginning of exon 7.

