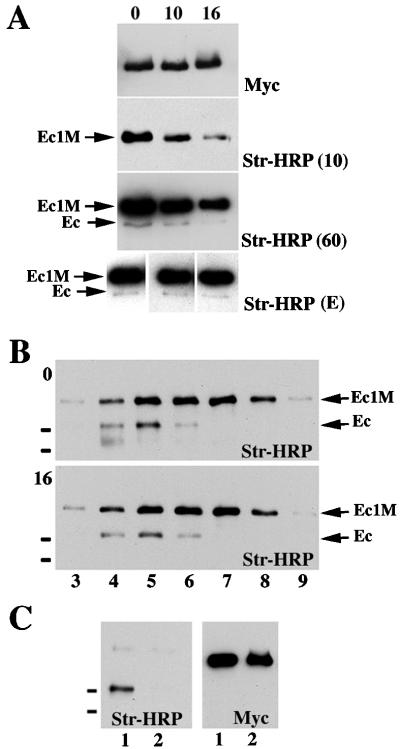
FIG. 7.
Metabolic stability of the dimeric and monomeric forms of E-cadherin. (A) Surface proteins of AEcM cells grown in 5-cm-diameter dishes were biotinylated and then chased in regular media. The chase times (in hours) are indicated above the blots. Cells were immunoprecipitated with an excess of anti-myc antibody, and the immunoprecipitates were adjusted to 60 μl with SDS-polyacrylamide gel electrophoresis sample buffer. Five microliters of each immunoprecipitate was loaded. The blots were probed either with streptavidin-HRP (Str-HRP) or anti-myc antibody (Myc). Three different exposure times of the blot developed by Str-HRP are shown. After an exposure time of 10 s [Str-HRP (10)], only the Ec1M protein was visualized, allowing us to estimate the half-life of the monomeric E-cadherin. A longer, 60-s exposure [Str-HRP (60)] visualized coimmunoprecipitated endogenous cadherin (Ec). The blots at the bottom of panel A [Str-HRP (E)] show blots of different exposure times equilibrated on the Ec1M signals, which allowed us to demonstrate that the ratio of Ec1M to endogenous cadherin did not change during the chase periods. Panel B is identical to panel A except that cell lysates before anti-myc immunoprecipitation were subjected to sucrose gradient centrifugation either immediately after the biotinylation (blot 0) or after the 16-h chase (blot 16). The exposure time of blot 0 was shorter than that of blot 16, showing that during the 16-h chase the Ec1M/E-cadherin ratio did not change. Note that immunoprecipitation of Ec1M leads to coimmunoprecipitation of the endogenous E-cadherin (Ec) only in fractions 4 to 6. (C) Surface-biotinylated A-431 cells were dissociated by EGTA and either cocultured for additional 8 h with AEcM cells (lane 1) or cultivated separately and combined after lysis (lane 2). The latter served as a control, showing the absence of interactions between cadherin molecules in solution. The small black bars on the left of the blots indicate the positions of molecular mass markers of 116 and 97.4 kDa.

