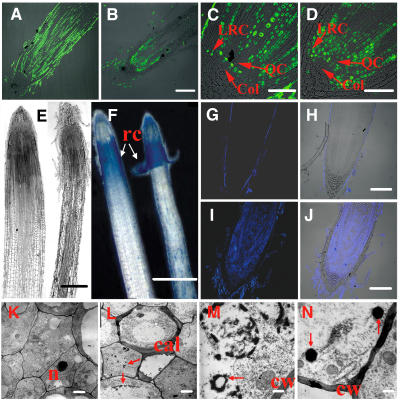
Figure 6.
Cell Division and Programmed Cell Death Were Investigated in the RAM of the GLR3.1 Mutant.
Cell division activity is shown in longitudinal sections of the root apex of 3-d-old seedlings supplied with 10 μM BrdU for 24 h. Immunofluorescence identifies nuclei in which BrdU was incorporated during DNA synthesis.
(A) Root apex of the wild type.
(B) Root apex of the mutant.
(C) Enlargement of (A). Col, columella; LRC, lateral root cap; QC, quiescent center.
(D) Enlargement of (B).
(E) Longitudinal sections of wild-type (left) and mutant (right) root tips of 7-d-old seedlings.
(F) Evans blue staining of the roots of wild-type and GLR3.1 3-d-old seedlings. Blue spots show the dead cells. rc, root cap.
(G) to (J) Root tips stained using the terminal deoxynucleotidyl transferase–mediated dUTP nick-end labeling (TUNEL) method.
(G) Fluorescence (stained by TUNEL) image of a wild-type root tip.
(H) Overlap of fluorescence and photo images of a wild-type root tip.
(I) Fluorescence (stained by TUNEL) image of a mutant root tip.
(J) Overlap of fluorescence and photo images of a mutant root tip.
(K) Electron micrograph of cells in the meristem of a wild-type root. n, nucleus.
(L) to (N) Electron micrographs of cells undergoing programmed cell death in mutants.
(L) Callose deposition and chromatin condensation (arrows) at the early stages of programmed cell death. cal, callose.
(M) Chromatin condensation in the later stages of programmed cell death. A nuclear membrane (arrow) has become fragmented and discontinuous. cw, cell wall.
(N) Formation of apoptosis-like bodies (arrows).
Bars = 100 μm ([A], [B], and [G] to [J]), 50 μm ([C] and [D]), 200 μm (E), 500 μm (F), 1 μm ([K] and [L]), and 200 nm ([M] and [N]).

