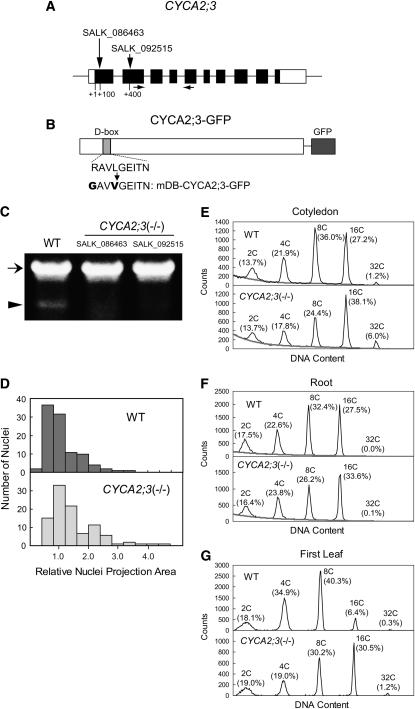
Figure 2.
Analysis of Loss-of-Function Mutations of CYCA2;3.
(A) The exon (boxes) and intron (lines) structure of CYCA2;3. Coding and noncoding regions are shown as black and white boxes, respectively. Vertical arrows indicate the sites of the T-DNA insertions in the lines SALK_086463 and SALK_092515. Horizontal arrows indicate the positions of the primers used in RT-PCR analysis.
(B) Structure of the fusion protein CYCA2;3-GFP. The amino acid sequence of the D-box and the altered sequence in mDB-CYCA2;3-GFP are shown below.
(C) RT-PCR analysis of CYCA2;3 expression in wild-type and CYCA2;3(−/−) plants of the SALK_086463 and SALK_092515 lines. RT-PCR was performed using total RNA prepared from 2-week-old plants. The positions of the bands corresponding to the ACT2 (a positive control; At3g18780) and CYCA2;3 transcripts are indicated by an arrow and an arrowhead, respectively.
(D) Comparison of the sizes of nuclei in trichomes of wild-type (top) and CYCA2;3(−/−) (bottom) plants. The nuclei were stained with 4′,6-diamidino-2-phenylindole (DAPI), and the projection area was measured microscopically (see Methods). To calculate the relative value, the mean nuclear projection area from wild-type trichomes was arbitrarily set to 1.
(E) to (G) Ploidy distribution patterns in cotyledons (E), roots (F), and first leaves (G) of wild-type (top panels) and CYCA2;3(−/−) (bottom panels) plants. Seedlings grown under normal light conditions for 4 DAG ([E] and [F]) or 14 DAG (G) were dissected and subjected to flow cytometry. Ploidy levels and the proportion of cells with those levels are indicated above each peak. The gray lines in (E) and (F) are the calculated baselines (see Methods).

