
Figure 2. RNAP moves in discrete steps.
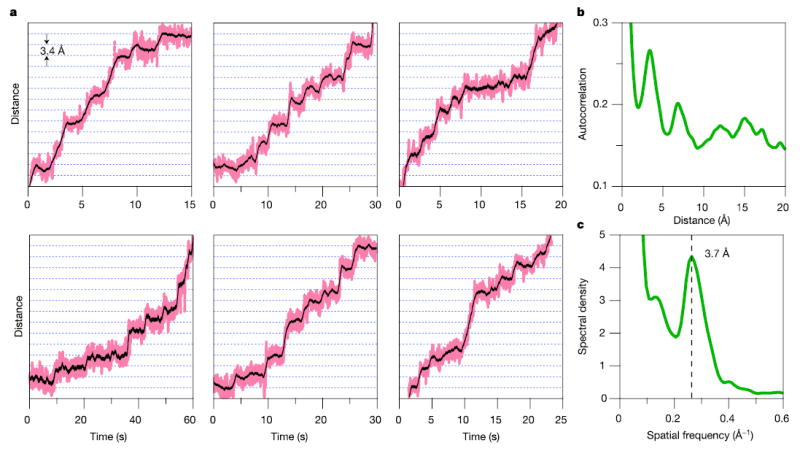
a, Representative records for single molecules of RNAP transcribing at [NTP]eq under 18 pN of assisting load, median-filtered at 50 ms (pink) and 750 ms (black). Horizontal lines (dotted) are spaced at 3.4-Å intervals. b, The average autocorrelation function derived from position histograms (N = 37) exhibits periodicity at multiples of the step size. c, The power spectrum of b shows a peak at the dominant spatial frequency, corresponding to the inverse of the fundamental step size, 3.7 ± 0.6 Å.