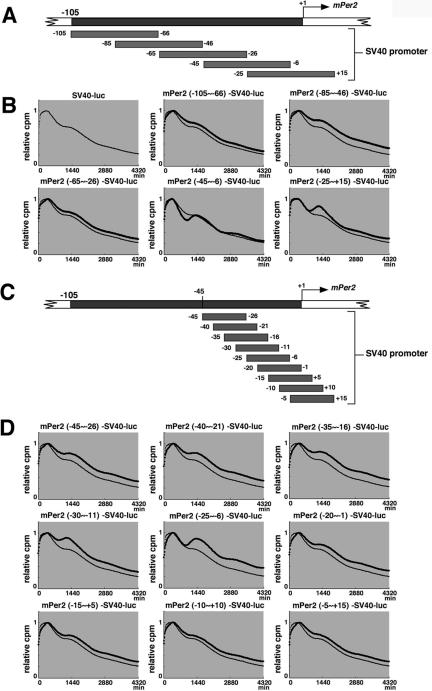
Figure 2.
Identification of the region responsible for driving cell-autonomous circadian oscillation of Per2 transcription. (A) Schematic representation of a set of constructs in which a 40-base pair fragment from Per2 (-105 to +15) was inserted into the upstream of the SV40 promoter attached to the luciferase gene. These fragments overlap by 20 base pairs. (B) Transcriptional oscillation of mPer2-SV40-luc was monitored. NIH3T3 cells were transfected and then stimulated with a high concentration of serum. After the serum shock, light emission was measured and integrated for 1 min at intervals of 15 min (vertical scale: relative cpm; horizontal scale: 1440 min = 1 d). Peak values of the curves were set to 1. A representative result of three independent experiments is shown. For accurate comparison, thin lines show the curve for “SV40-luc.” (C) Schematic representation of another set of constructs, in which a 20-base pair fragment from Per2 (-45 to +15) was inserted into the upstream of the SV40 promoter attached to the luciferase gene. These fragments overlap by 15 base pairs. (D) Transcriptional oscillation of mPer2-SV40-luc was monitored. Peak values of the curves were set to 1 (horizontal scale: 1440 min = 1 d). A representative result of three independent experiments is shown. For accurate comparison, thin lines show the curve for “SV40-luc.”

